Centre for Science and Technology Studies
Centre for Science and Technology Studies
2333AL
Leiden
Zuid Holland
31715273909
Tsinghua University UIC profile
An overview on the University-Industry co-publication activity of Tsinghua University in the scientific landscape.
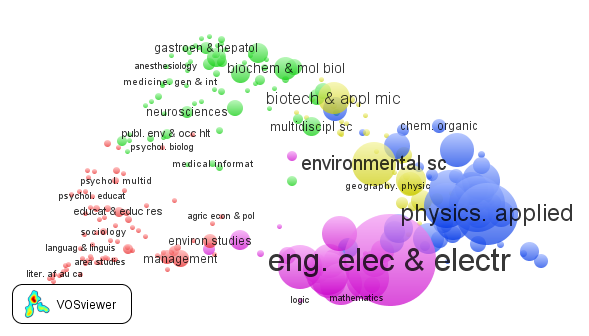
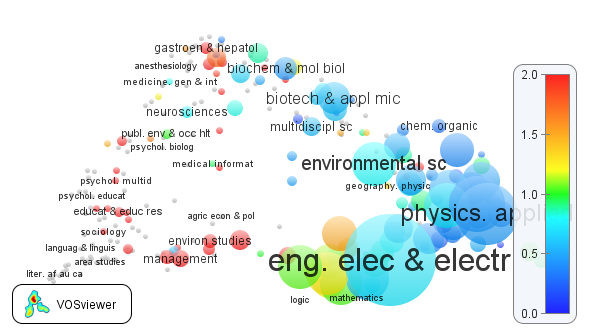
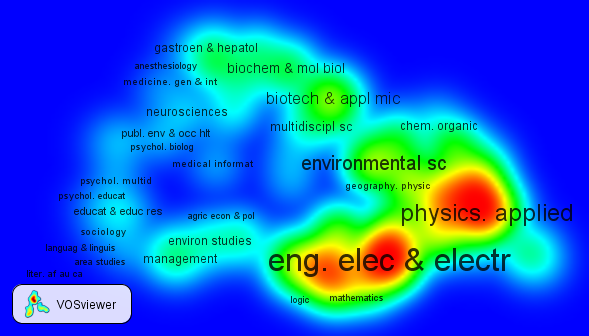
These three images shown below are three different views of the same map, representing the University-Industry co-publication activity of Tsinghua University in the map of science. Clicking on a map allows the exploration of the map using the VOSviewer software. The software requires Java version 6 or higher to be installed on your system.
Some of the main companies co-publishing with Tsinghua University can be visualized in the density map by placing the pointer of the mouse over the red areas in the map.
Tsinghua University UIC map - subject area clustering
Tsinghua University UIC map - UIC activity
Tsinghua University UIC map - UIC density
The interpretation of a term map is as follows:
-
The underlying structure of the map represents the whole scientific landscape, using the subject areas in the Web of Science. Each subject area is represented by a circle and in this structure the distance between two subject areas indicates their relatedness. In general, the closer two subject areas are located to each other, the stronger their relatedness, as measured by the citation flows between each other. Sometimes no label is shown for a subject area. This is done in order to avoid overlapping labels. The horizontal and vertical axes have no special meaning. Rotating a map does not affect its interpretation.
-
Absolute activity: the size of the subject area represents the number of University-Industry co-publications. Related subject areas have been grouped together into clusters. The color of a subject area indicates the cluster to which belongs, gathering several subject areas into broader scientific areas.
-
Relative activity: the size of the subject area represents the number of University-Industry co-publications. The color scale (ranging from blue to red) represents the University-Industry co-publication activity in each subject area relative to the worldwide University-Industry co-publication activity. Red areas concentrate a higher share of joint University-Industry publications.
- Density: subject areas are represented by a label. Each of these subject areas in a map has a color, ranging from blue to red, which depends on the density of disciplines at that point. The larger the number of disciplines in the neighborhood and the higher the number of University-Industry co-publications of the neighboring disciplines, the closer the color of the point is to red.


